Interaction Logic
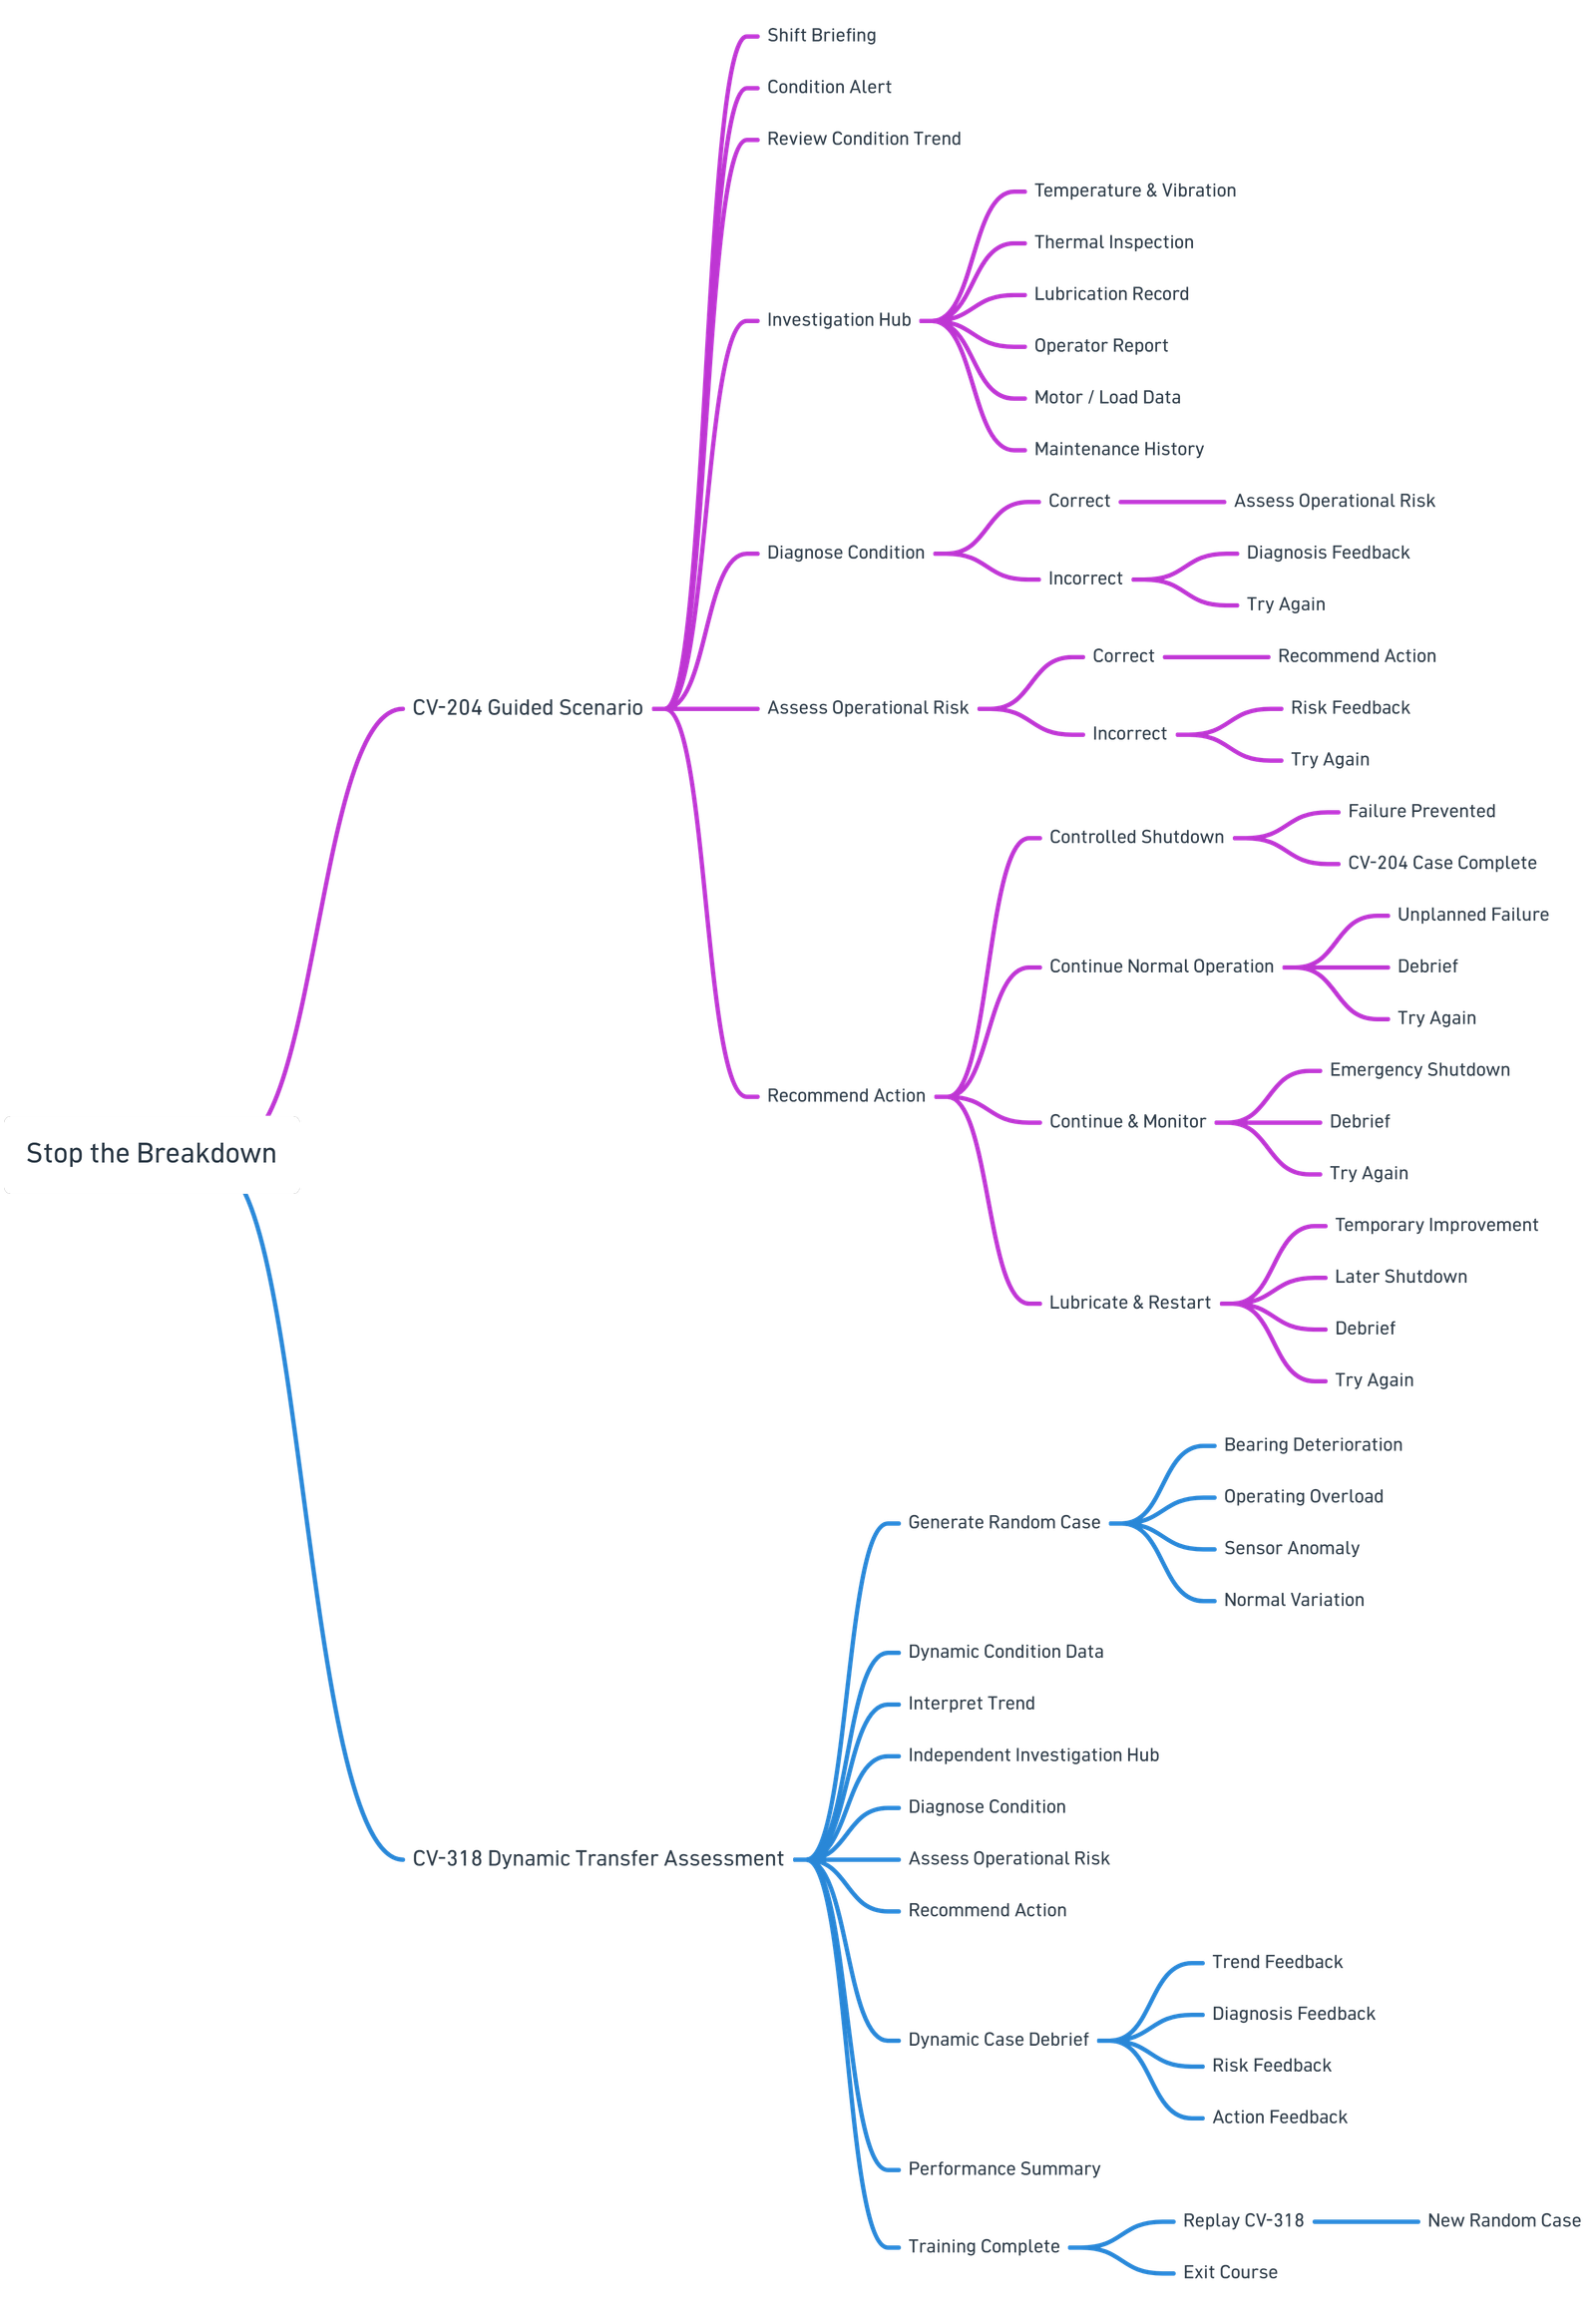
Variables, triggers, states, layers, branching, persistent visited states, and replay behaviour.

Predictive Maintenance Decision Simulation
An interactive maintenance investigation where learners review condition data, diagnose a developing equipment problem, assess operational risk, and decide what should happen next.
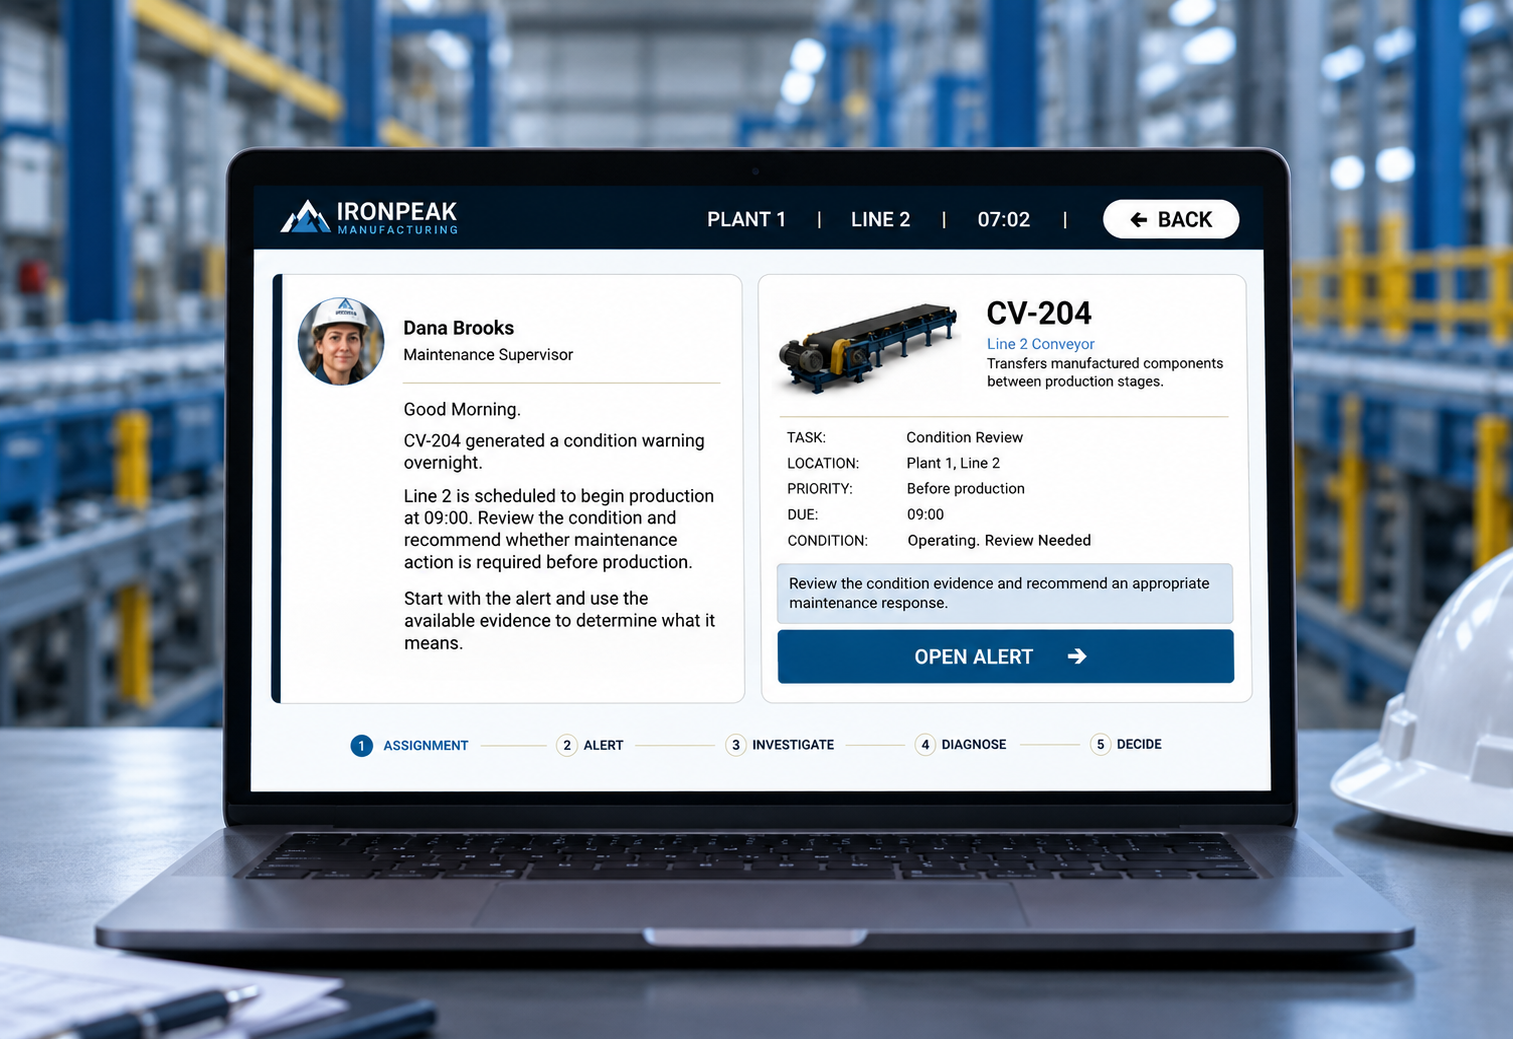
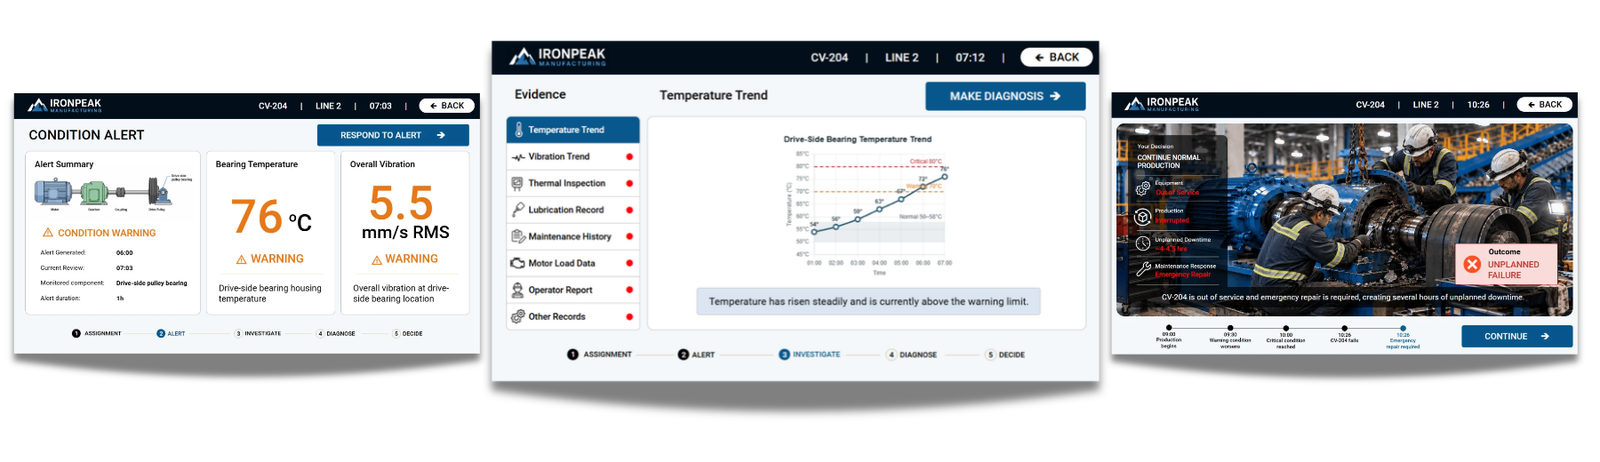
A technician may need to compare equipment history, operator observations, condition-monitoring data, inspection findings, and operating context before deciding what the evidence means.
The learning challenge was not to teach isolated facts. It was to create a safe environment where the learner could investigate, interpret, diagnose, and act.
The experience moves from alert to evidence, diagnosis, risk assessment, decision, and consequence.
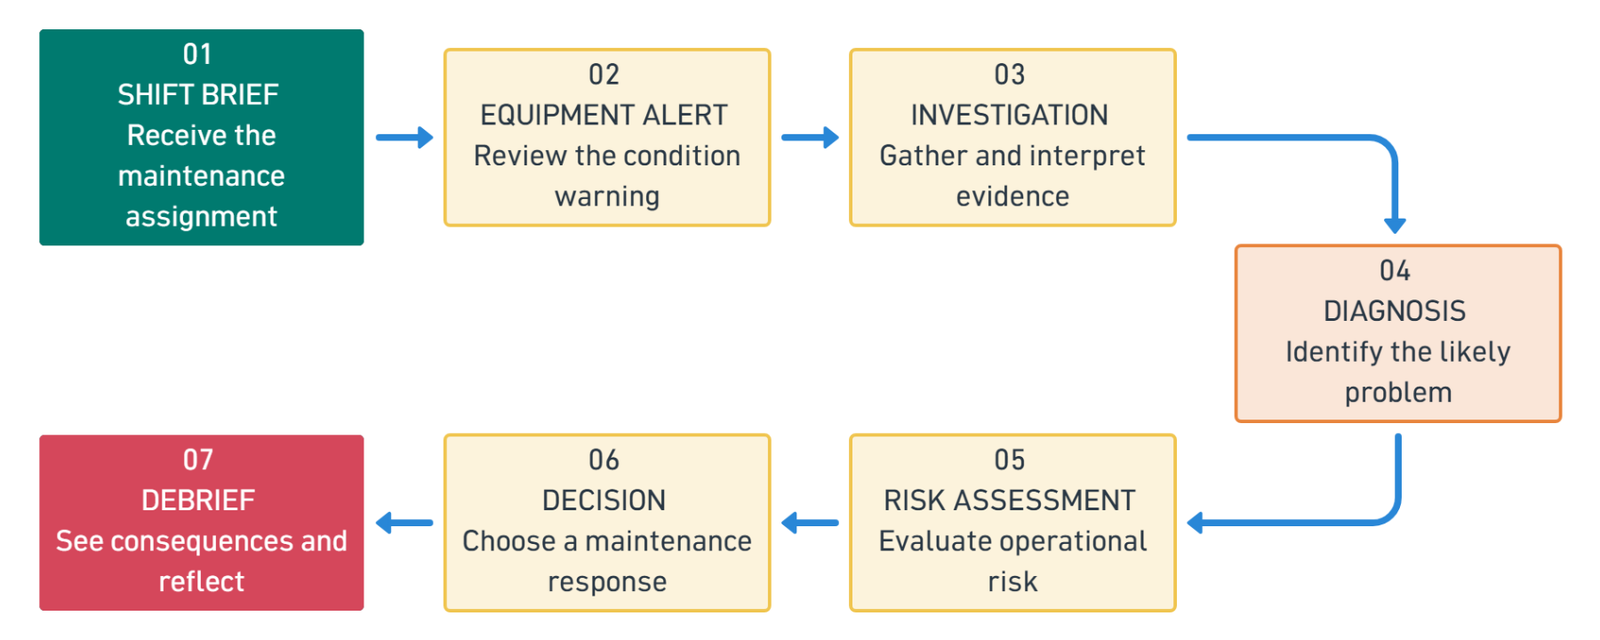
I kept the workflow focused on the decisions the learner needed to make and the evidence required to support those decisions.
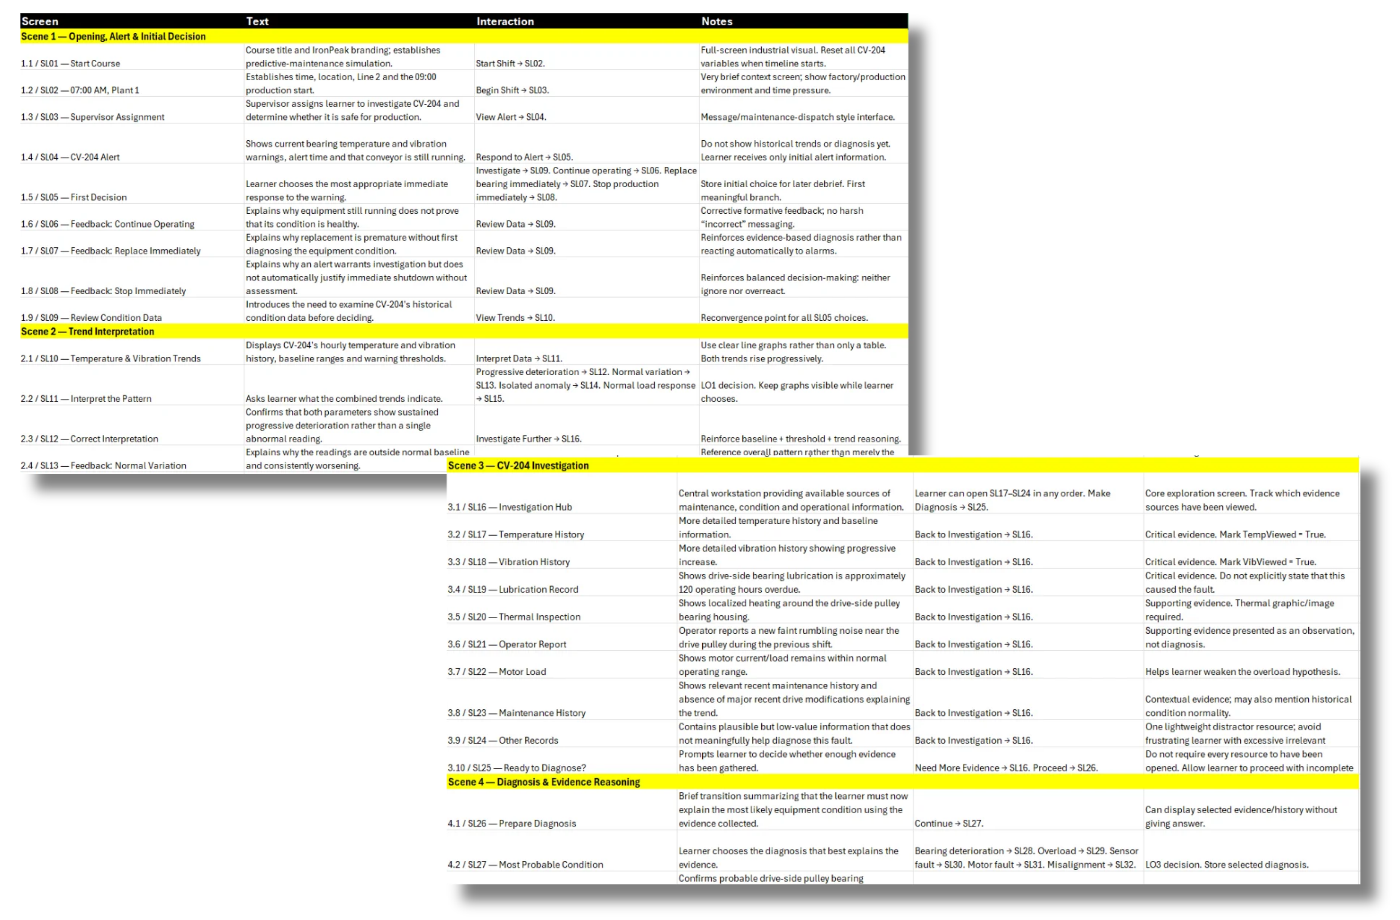
The storyboard mapped each screen, on-screen content, learner action, feedback or consequence, and development notes. This kept instructional intent and Storyline behaviour aligned.
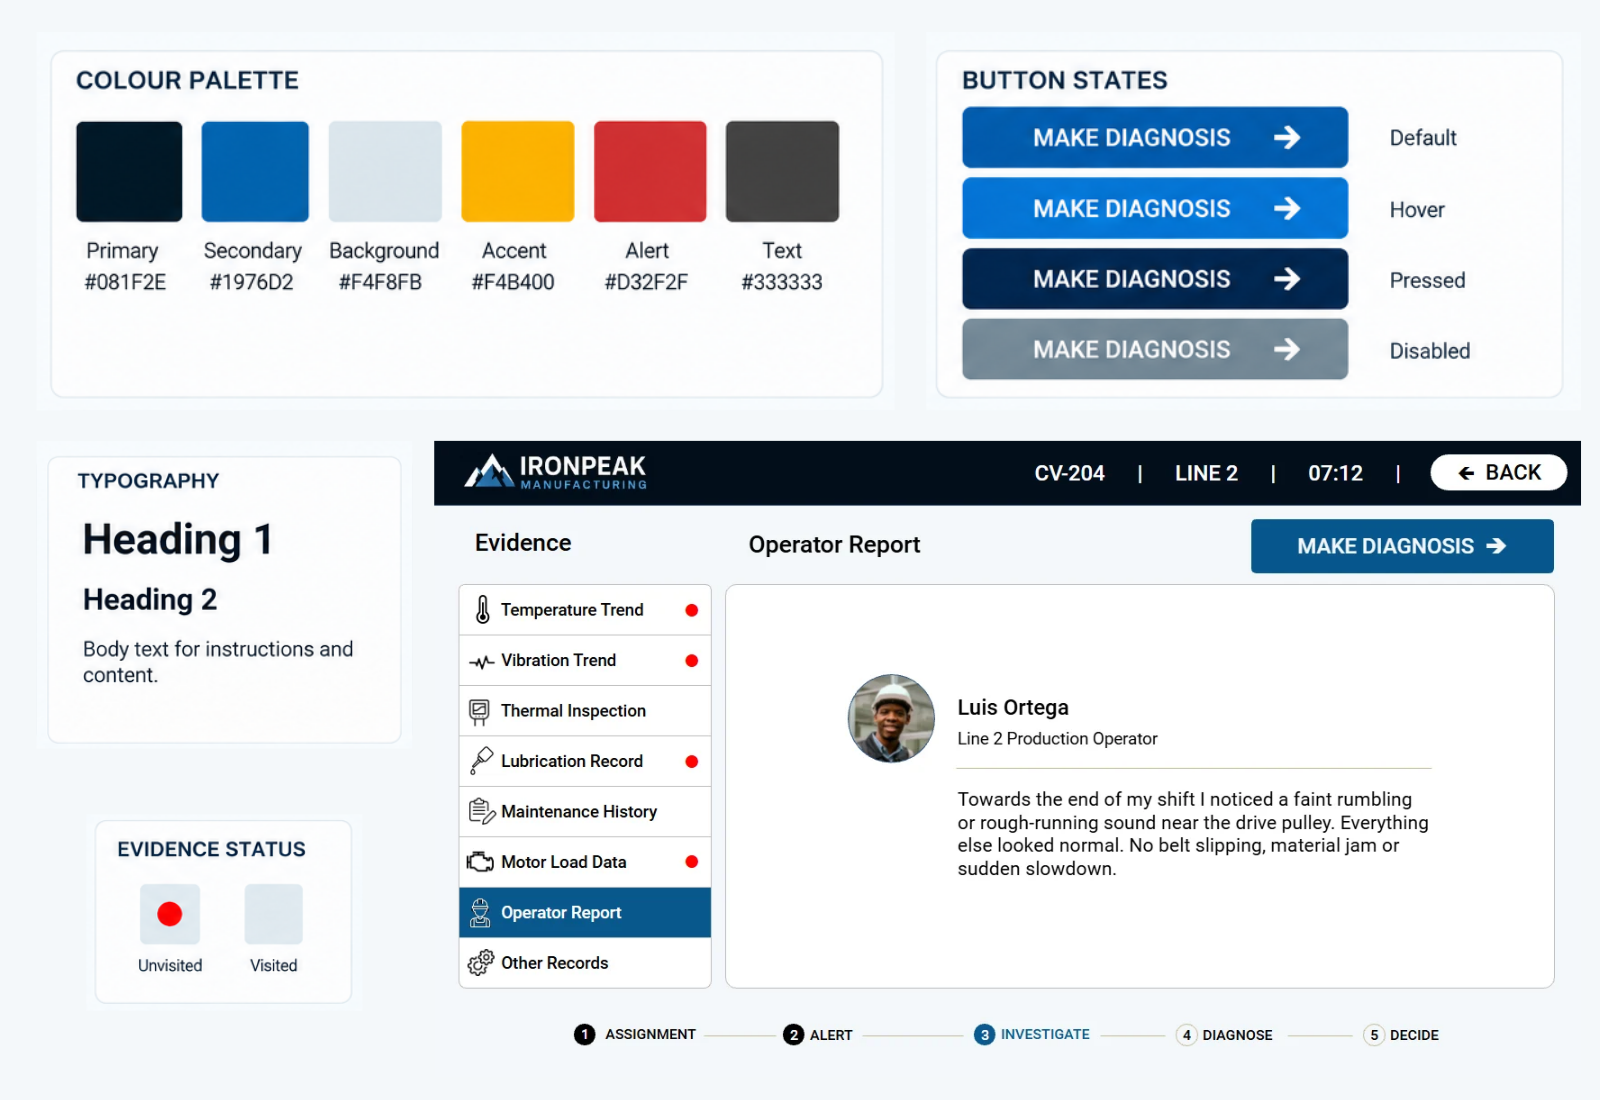
The visual system defined typography, color, buttons, states, icons, layout zones, and reusable interface elements before full development.
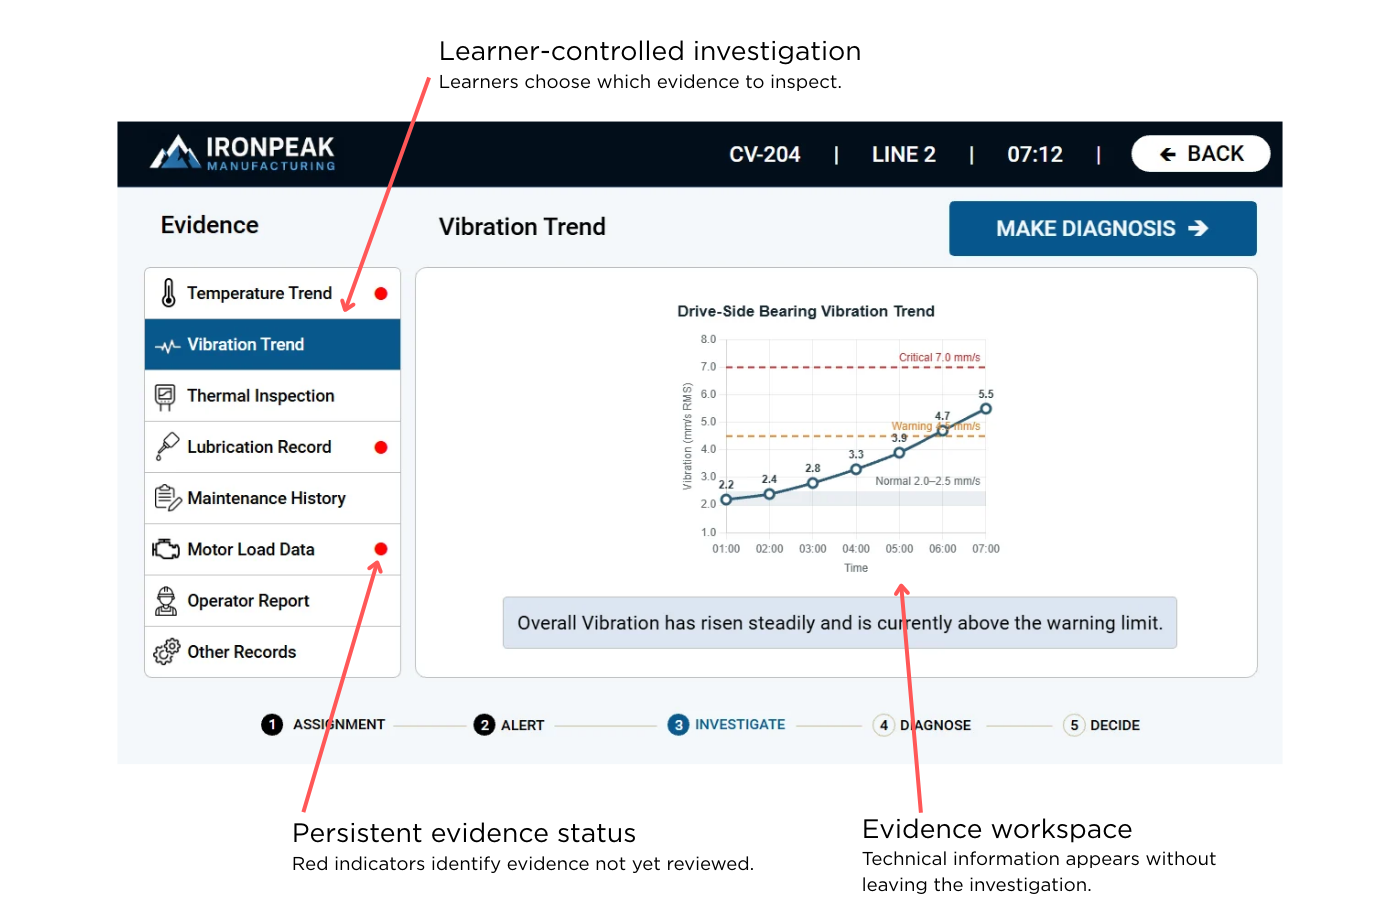
Instead of presenting evidence in a fixed sequence, the hub allows the learner to choose what to inspect. Unvisited evidence is marked, and the interface remembers what has already been reviewed.
CV-318 can present a different controlled condition when the experience is replayed. JavaScript generates case data, passes values into Storyline, and Chart.js turns those values into condition-monitoring graphs for the learner to interpret.
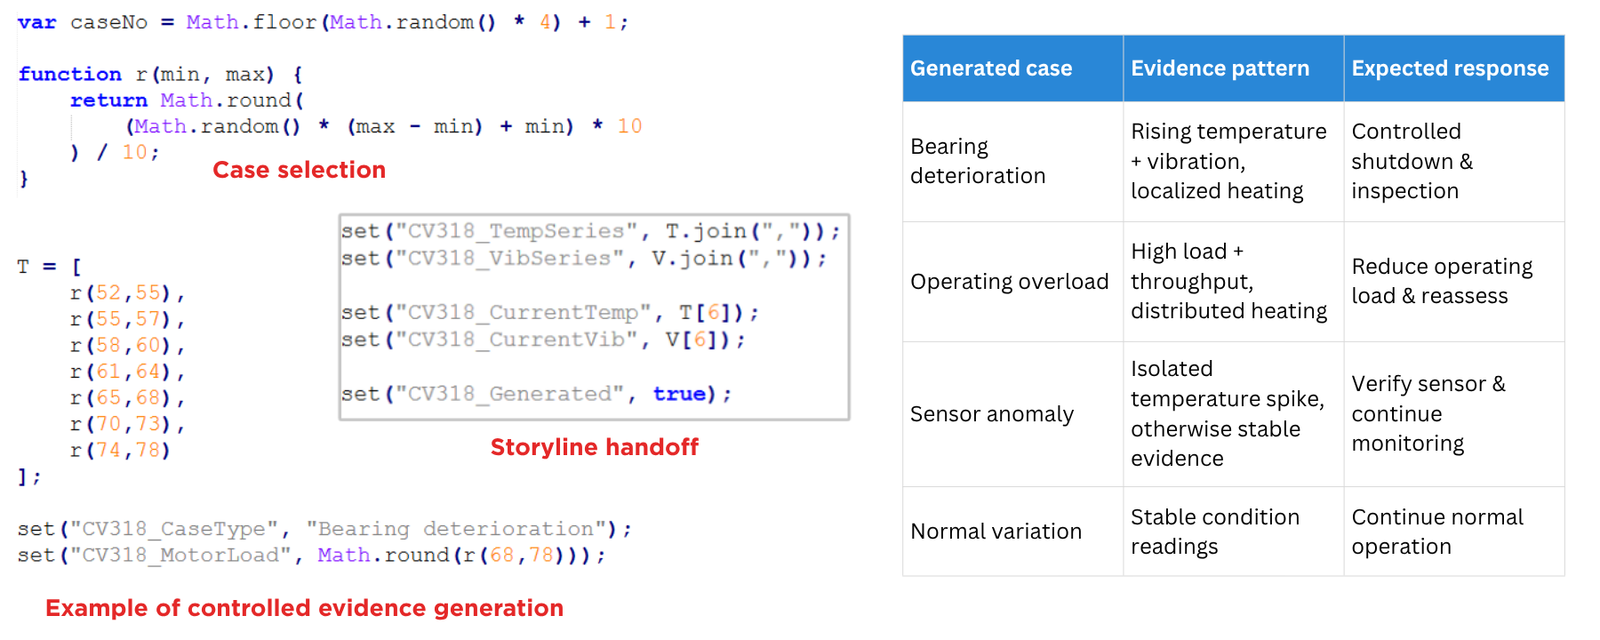
Values change within designed case constraints rather than becoming arbitrary noise.
Generated values are passed into Storyline variables and used by the experience.
Chart.js presents condition trends that the learner must interpret as evidence.
Diagnosis feeds into risk assessment and operational decision-making. Different choices lead to different consequences and debriefs, so feedback remains connected to the maintenance context.
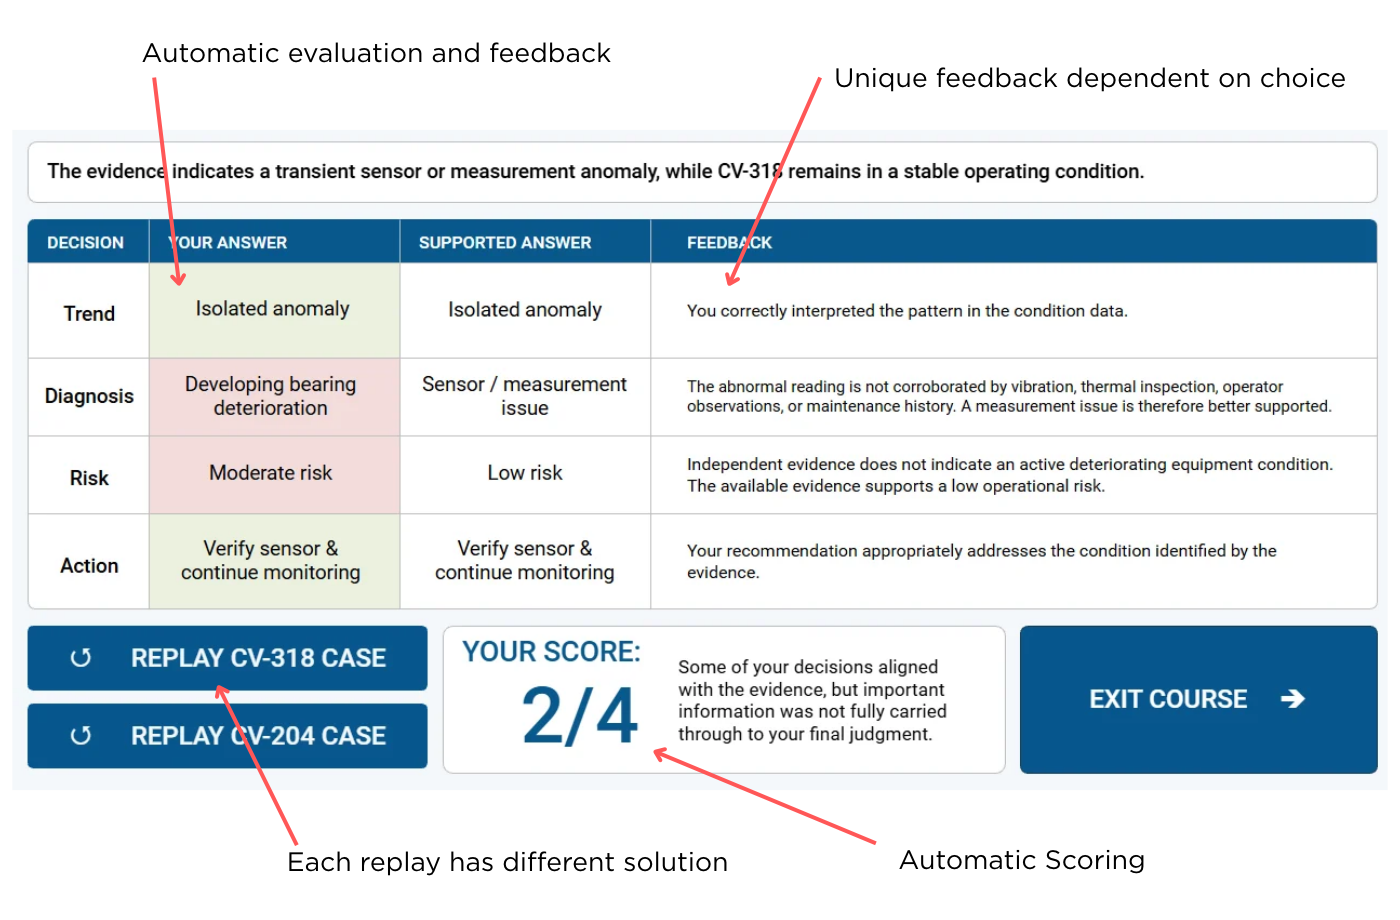
Variables, triggers, states, layers, branching, persistent visited states, and replay behaviour.
Controlled case generation and custom trend visualizations that change the evidence on replay.
Investigation, evidence interpretation, diagnosis, risk assessment, consequences, and debriefing.
Checked navigation and branching across the major decision paths.
Refined visited-state behaviour so evidence indicators remain cleared after review.
Adjusted replay and retry behaviour to avoid forcing learners through repeated animations.
Tested generated condition data for consistency with the intended case logic.
Technical troubleshooting is more credible when learners must weigh evidence instead of spotting an obvious answer.
The investigation hub is interactive because evidence gathering is part of the performance, not simply because tabs are available.
Randomized cases turn replay into another diagnostic opportunity rather than repetition of the same path.
Review the evidence, diagnose the problem, assess the risk, and decide what happens next.
Launch Stop the Breakdown ↗